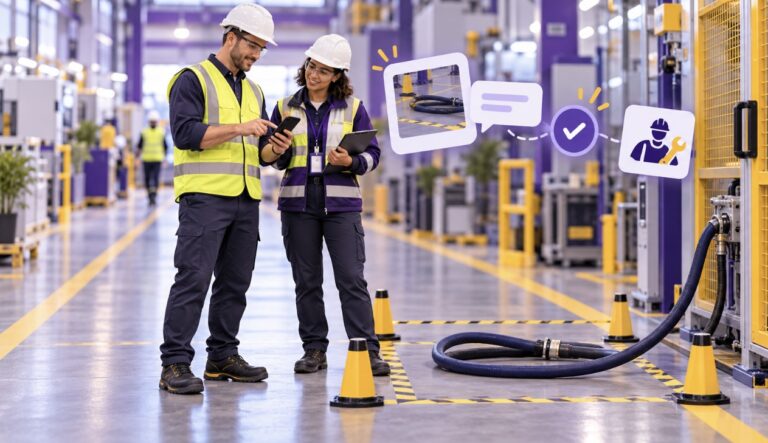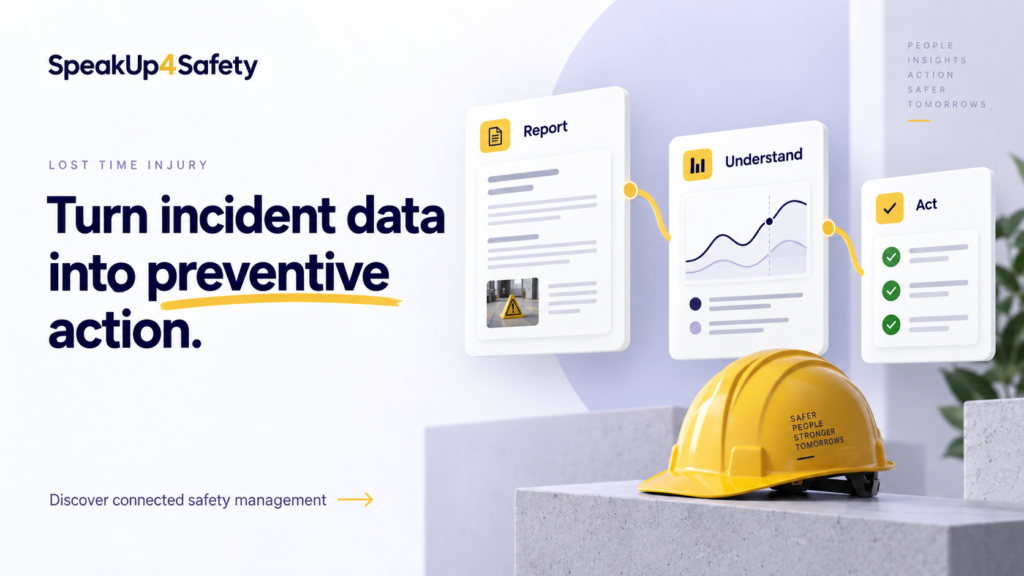
Lost Time Injuries are more than a compliance metric. They show when an incident disrupts normal work, affects a worker’s recovery and creates measurable operational loss.
This guide explains what qualifies as an LTI, how to calculate and interpret the rate across reporting systems, and how connected incident data can support preventive action.
Need the number now? Use the free LTIR calculator below, or see how incident management software tracks lost time injuries, hours worked and corrective actions automatically.
- From incident data to preventive action
- Understand the event
- Measure performance
- Prevent recurrence
What is a Lost Time Injury?
Lost Time Injuries show when an incident disrupts normal work and requires time away from the job.
A lost time injury (LTI) is a work-related injury that causes time away from work. The injured worker cannot perform their normal duties. In other words, the employee cannot return to their regular job after the incident.
Lost time injuries help teams assess the impact of workplace accidents. They show when an injury disrupts work and requires recovery. As a result, safety teams can identify hazards and report incident rates more accurately.
An incident is recorded as a lost-time injury when the employee:
- Cannot return for their next scheduled shift
- Is unable to carry out their usual job tasks
- Needs time away from work to recover
- Is placed on restricted or modified duties because of the injury
Note: Injuries that only require first aid and do not affect work duties are not counted.
A lost time injury is also called a lost time accident or lost time incident. Safety reports usually shorten the term to LTI. Tracking these injuries helps organizations identify risks, improve training and prevent serious accidents.
How did it happen?
LTIs often develop when unsafe conditions, unsafe actions and organizational weaknesses combine.
Common causes include poor housekeeping and faulty equipment. Rushed work, limited training and ignored safety rules can also increase the risk.
Real-life example
Consider a technician handling a heavy valve on a drilling rig. The valve slips and crushes the technician’s foot. As a result, the worker cannot stand or walk for several days.
Because they cannot return for their next scheduled shift, this becomes a lost time injury.
If a worker suffers a small burn but continues working after first aid, that incident would not be counted as a lost-time injury.
Analyzing how and where incidents happen helps organizations identify weaknesses in safety systems and take action before similar injuries occur.
Causes of Lost Time Injuries
Lost Time Injuries often arise when several risks overlap. These include workplace hazards, human factors and weaknesses in the safety management system.
| Cause | How it increases risk | Typical indicators |
|---|---|---|
| Unsafe work practices | Procedures or established controls are bypassed during the task. | Skipped checks; unsafe equipment handling; unprotected work at height; ignored warnings. |
| Training and knowledge gaps | Workers cannot reliably recognize hazards or apply the correct response. | Weak hazard recognition; limited emergency knowledge; poor procedural understanding. |
| Ergonomics and work design | Workstations, tools or workflows place avoidable strain on the worker. | Repetitive motion; poor workstation layout; heavy handling without mechanical aids. |
| Environmental hazards | Physical conditions make slips, contact, loss of control or exposure more likely. | Uneven floors; poor lighting; noise or heat; unsecured materials and falling objects. |
| Human factors | Fatigue, stress and complacency reduce attention and risk perception. | Long shifts; overtime; production pressure; routine-task complacency. |
| Management system gaps | Weak governance allows hazards and unsafe behavior to persist. | Unclear policies; poor reporting and follow-up; understaffing; weak accountability. |
Why tracking LTIs matters
Tracking LTIs does more than count injuries. It also shows how incidents affect employees and operations.
Spot problem areas
Identify tasks or locations where injuries frequently occur.
Understand productivity loss
Each LTI represents lost workdays and potential delays.
Improve safety culture
Employees see that incidents are taken seriously, encouraging safer behavior.
Prevent future injuries
Insights from past incidents allow proactive safety measures.
Support better decisions
Accurate tracking gives management a clearer basis for prioritization and follow-up.
Monitor safety metrics
Use LTI rate together with total incident rate and other leading and lagging indicators. Explore our safety KPI dashboard guide to bring these measures together.
Still tracking LTIs in spreadsheets? Teams often store injury records, hours worked and corrective actions in separate files. This makes each reporting cycle harder. Incident management software brings the records together and updates KPIs as teams report events.
How safety KPIs differ by country
The formulas may look similar. However, they use different case definitions, exposure measures and benchmark populations. Therefore, their results are not directly interchangeable.
Use the framework that matches your jurisdiction and reporting purpose. Compare your result only with a benchmark built from the same numerator, denominator, period and workforce population.
| System | KPI and definition | Calculation basis | Benchmark and official reference |
|---|---|---|---|
| United States OSHA / BLS |
TRIR measures all OSHA-recordable cases. DART covers recordable cases involving days away, restricted work or job transfer. | Cases × 200,000 ÷ hours worked |
Compare by NAICS industry and, where possible, establishment size. BLS incidence-rate tables. |
| Australia Safe Work Australia |
WCIFR is the number of workers’ compensation claims per million hours worked. Lost-time claims can be selected as the claim type. | Claims × 1,000,000 ÷ hours worked |
Match claim type, ANZSIC industry and period. Safe Work Australia dashboard. |
| Italy INAIL |
Frequency index relates compensated occupational injuries to addetti-anno. The severity index reflects lost days per insured worker. | Compensated injuries × 1,000 ÷ addetti-anno |
Use consolidated data by ATECO activity, territory and company size. INAIL Open Data. |
| Switzerland Suva |
Accidents per 1,000 FTE supports company and industry comparison; absence days and costs remain separate indicators. | Occupational accidents × 1,000 ÷ FTE-years |
Use the matching insured population and industry. mySuva company statistics. |
| International / internal | LTIFR normalizes lost-time injuries against hours worked. Organizations must document what counts as an LTI. | LTI × 1,000,000 ÷ hours worked |
No universal benchmark is assumed. Use an equivalent internal or published dataset and disclose the definition and period. |
Methodology warning: multiplying an OSHA rate by five does not make it equivalent to an Australian WCIFR or internal LTIFR. The underlying cases are different.
How to calculate Lost Time Injury Rate (LTIR)
Safety teams use the Lost Time Injury Rate (LTIR) to track how often Lost Time Injuries occur relative to total hours worked. This metric allows organizations to compare safety performance across teams, sites or time periods, even when workforce size changes.
LTIR = (Number of Lost Time Injuries × 1,000,000) ÷ Total Hours Worked
-
Number of Lost Time Injuries:
Count of incidents where employees were unable to work after the day of the injury. -
Total Hours Worked:
Total hours worked by all employees during the same period. -
1,000,000:
Standard multiplier used to express the rate per million hours worked.
Some organizations use 200,000 for OSHA-style comparisons.
Example
If 8 Lost Time Injuries occur over 500,000 hours worked:
LTIR = (8 × 1,000,000) ÷ 500,000 = 16.00
This corresponds to a rate of 16 Lost Time Injuries for every 1,000,000 hours worked.
Calculate and interpret your safety rate
Select the reporting framework, enter the matching exposure data and compare the result with a methodologically compatible benchmark.
Calculation and methodology notes
- USA: TRIR or DART = cases × 200,000 ÷ hours actually worked. DART means cases, not days. Embedded benchmarks are fixed BLS 2024 private-industry rates.
- Australia: WCIFR = workers’ compensation claims × 1,000,000 ÷ covered hours. Match the claim type, industry and period used by Safe Work Australia.
- Italy: the company estimate uses compensated occupational injuries × 1,000 ÷ addetti-anno and excludes commuting injuries. Official INAIL indices use consolidated data and adjustments.
- Switzerland: occupational accidents × 1,000 ÷ FTE-years. Use average annual FTE for one complete year or sum annual FTE across multiple years.
- International: internal LTIFR = lost-time injuries × 1,000,000 ÷ hours worked. Document the LTI definition.
- The difference is descriptive: it is not a safety grade or a statistical-significance test. Review serious events, severity, reporting quality and controls.
Note: LTIR is typically calculated for yearly or long-term safety tracking, not for short periods such as daily or weekly counts.
Calculate LTIR automatically, every month
The calculator above is useful for a one-off check. For multiple sites or teams, SpeakUp4Safety links incident reports, investigations and corrective actions. This helps keep LTI data current and ready for management review.
How to prevent Lost Time Injuries
Preventing LTIs requires practical controls, learning from events and consistent follow-up.
Regular inspections
Walkthroughs and checklists catch hazards early, such as damaged machinery or slippery floors.
Near-miss reporting
Workers log incidents that could have caused injury, triggering quick corrective actions.
Hands-on training
Employees practice safe lifting, PPE use and emergency response.
Immediate corrective actions
Hazards are fixed promptly, supported by stop-work and escalation processes. Learn how to build a corrective action plan and verify that completed actions prevent recurrence.
Behavioral safety programs
Employees are recognized for safe practices and coached on risky behaviors.
Data-driven decisions
Past incidents and trends guide preventive actions and resource allocation.
Prevention works best when reporting is easy. Give workers a simple way to report near misses, unsafe conditions and injuries. Use near-miss and incident reporting software to capture reports from the field. Then assign corrective actions and verify their completion.
LTI management software: how SpeakUp4Safety helps
Connect reporting, investigation, corrective actions and management follow-up in one system.
Managing LTIs becomes easier when safety information is handled in one digital system. SpeakUp4Safety gives safety teams a clear, real-time view of what is happening on the ground so they can act before small issues turn into serious injuries.
From lagging indicator to preventive insight.
Lost Time Injuries reflect the real challenges of workplace safety. By understanding what LTIs are, tracking them carefully, calculating metrics and taking preventive action, organizations can protect employees, reduce downtime and strengthen safety culture.
Leveraging modern digital tools like SpeakUp4Safety makes this process easier and more effective, turning safety data into a stronger basis for preventive action.
From injury metrics to prevention: explore the Safety KPI Analyzer and SpeakUp4Safety plans.
Bring incident data, investigations and corrective actions together.
Record lost time injuries, calculate your rates, investigate root causes and close corrective actions in one system. Request a demo or test the forms on your own incident process.