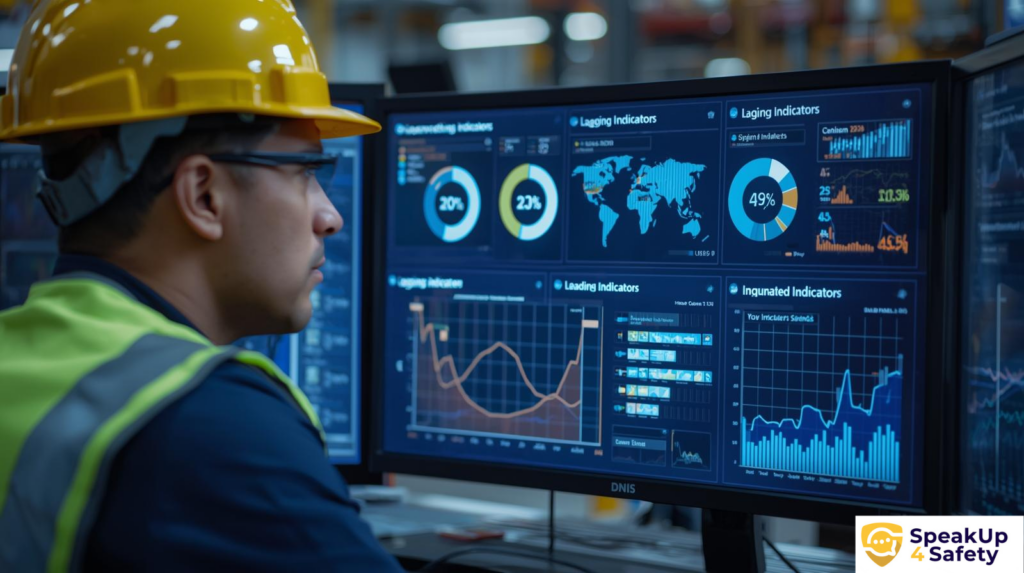
Safety KPIs & EHS Dashboard: From Metrics to Prevention
Safety KPIs show whether your safety program is preventing incidents—not just recording them. An EHS KPI dashboard brings leading and lagging indicators, trends and corrective actions together so teams can turn safety data into prevention. In this guide you’ll find 12 practical KPI examples with formulas, leading vs lagging indicators, a checklist for choosing EHS dashboard software, ISO 45001 alignment and a simple way to turn data into action.
Reliable dashboards start with consistent data capture. Standardize reporting with our near miss reporting software.
See an EHS KPI Dashboard in action
SpeakUp4Safety connects operational reporting, Safety KPIs and corrective actions in one management workflow. Start with the dashboard below, then explore how each indicator supports prevention.

Leading & lagging KPIs
Bring incident outcomes and preventive activity into the same review.
Trends & hotspots
Use recurring hazards and reporting patterns to decide where to act first.
Actions & effectiveness
Connect findings to owners, due dates and evidence of improvement.
Start with the free Safety KPI Analyzer: enter your monthly hours and injury data, explore rolling trends and injury body patterns, and see the type of insight a connected dashboard can provide. When you want automatic data capture, live KPI updates, CAPA follow-up and multi-user workflows, move to a SpeakUp4Safety license.
Follow the workflow: choose your Safety KPIs → connect them to CAPA → request a dashboard demo.
What Are Safety KPIs?
Key Performance Indicators (KPIs) for Safety are measurable values used to evaluate how effectively an organization controls health and safety risks. The best KPIs are actionable, aligned with real hazards, and reviewed on a regular cadence.
- Operational relevance: KPIs reflect real risk exposure.
- Prevention focus: KPIs guide proactive interventions.
- Decision-ready: KPIs support fast prioritization.
Leading vs Lagging Safety Indicators
High-performing EHS teams balance lagging indicators (outcomes) with leading indicators (prevention activities). If you rely only on lagging metrics, you build a reactive system.
Lagging Indicators (Reactive)
- TRIR / recordable incidents
- LTIR / lost time cases
- Severity rate
- Days away / restricted work
Useful for reporting and benchmarking, but they describe what already happened.
Leading Indicators (Proactive)
- Near miss reporting rate
- Safety observations
- Corrective actions closed on time
- Training completion
They help detect weak signals and prevent incidents before injuries occur.
To make leading indicators reliable, capture data at the source (mobile or digital forms). This improves consistency and reduces under-reporting.
View the SpeakUp4Safety EHS KPI dashboard above to connect these indicators with trends and action performance.
Why Near Miss KPIs Are Critical
Near misses are early warnings. Tracking near miss KPIs strengthens worker participation, improves hazard detection, and accelerates corrective actions. Low reporting often signals under-reporting or limited engagement.
- Near miss reports per 100 employees
- Time to close corrective actions
- Repeat categories (e.g., slips, struck-by, pinch points)
- Near misses by department, task, or shift
These KPIs are only reliable when reporting is fast and consistent. Near miss reporting software lets workers submit reports from their phone and feeds the dashboard automatically.
Essential Safety KPIs to Monitor
A practical KPI set includes outcome metrics, proactive measures, and risk-based indicators. Keep dashboards focused: 8 to 15 KPIs are usually enough for clear decisions.
Core Safety KPIs
- TRIR, LTIR, severity rate
- First Aid cases
- Near miss rate
Proactive KPIs
- Safety observations submitted
- Unsafe conditions reported
- Corrective actions closed on time
- Training compliance rate
Risk-Based KPIs
- High-risk activity reports
- Recurring hazards by area/task
- Risk exposure trends (e.g., energy sources, critical tasks)
Safety KPI Examples and Quick Formulas
Use simple, consistent formulas. The goal is trend visibility and actionability, not perfect math. Here are 12 safety KPI examples you can start with. Always use the same period and the same hours or headcount for numerator and denominator.
- TRIR (total recordable incident rate): (Recordable incidents × 200,000) ÷ Total hours worked
- DART rate: (Cases with days away, restricted work or transfer × 200,000) ÷ Total hours worked
- LTIR / LTIFR: (Lost time injuries × 1,000,000) ÷ Total hours worked. Use our free LTIR calculator.
- Severity rate: (Lost workdays × 200,000) ÷ Total hours worked (use the same multiplier as your LTIR)
- Near miss rate: (Near miss reports ÷ Total employees) × 100
- Safety observations per 100 employees: (Observations submitted ÷ Total employees) × 100
- Average time to close an unsafe condition: Total days to close ÷ Number of unsafe conditions closed
- Corrective action closure rate: (Actions closed on time ÷ Actions due) × 100
- Overdue action rate: (Overdue actions ÷ Open actions) × 100
- Training compliance rate: (Workers with up-to-date training ÷ Workers requiring training) × 100
- Inspection completion rate: (Inspections completed ÷ Inspections planned) × 100
- Action effectiveness rate: (Actions verified as effective ÷ Actions verified) × 100
Need a step-by-step method? Read our guide on how to calculate health and safety KPIs and create KPI reports. In an EHS KPI dashboard, these formulas are calculated automatically from your incident, observation, training and action records.
What Is a Safety Dashboard?
A safety dashboard (or EHS KPI dashboard) is a visual overview that brings your key safety indicators, such as incident rates, near miss trends, open corrective actions and training status, into one place, so managers can see risk trends and decide where to act first. A good dashboard draws on live data from reporting, audits and corrective actions rather than on manually updated spreadsheets.
Decision question: Where should we act first to reduce risk? Dashboards help managers prioritize actions based on trends, hotspots, and real exposure.
What to Look for in EHS KPI Dashboard Software
Evaluate the complete workflow behind the charts. Use this checklist in your software demo to see how field data becomes a measurable, traceable improvement.
- Mobile data capture: collect incidents, near misses, unsafe conditions and supporting photos where work happens.
- Automatic KPI calculation: check how reporting periods, hours worked and agreed formulas turn source data into consistent indicators.
- Drill-down by site and department: move from the overall trend to the teams, locations and activities that need attention.
- Near miss and unsafe condition trends: identify recurring categories and changes in reporting alongside incident outcomes.
- CAPA integration: connect a dashboard finding to root cause analysis and corrective or preventive action.
- Owners and due dates: make accountability, overdue actions and follow-up visible.
- Effectiveness verification: review evidence and recurrence after implementation, rather than treating closure as proof of success.
- Audit trail: retain a traceable record of reports, decisions, action updates and verification.
Ask for a SpeakUp4Safety walkthrough using your own KPI priorities, site structure and CAPA workflow. Confirm the modules and plan that fit your organization before choosing a subscription.
Benefits of Digital Safety Dashboards
- Faster decisions with KPI visibility
- Higher data quality with standardized reporting
- Better corrective action management
- Stronger audit readiness and evidence
- Improved engagement through feedback loops
Safety KPIs and ISO 45001 Alignment
Safety KPIs support ISO 45001 by making performance measurable and improvement trackable:
- Clause 9.1 — Monitoring, measurement, analysis and evaluation
- Clause 5.4 — Worker participation and consultation
- Clause 10 — Improvement
Choose KPIs that link performance to actions (owners, due dates, and verification). This is what makes dashboards useful during audits.
Common Mistakes in Safety KPI Management
- Too many KPIs (noise instead of insight)
- Manual spreadsheets without governance
- KPIs not linked to corrective actions
- No segmentation by site/department/task
- Delayed reporting (no near-real-time view)
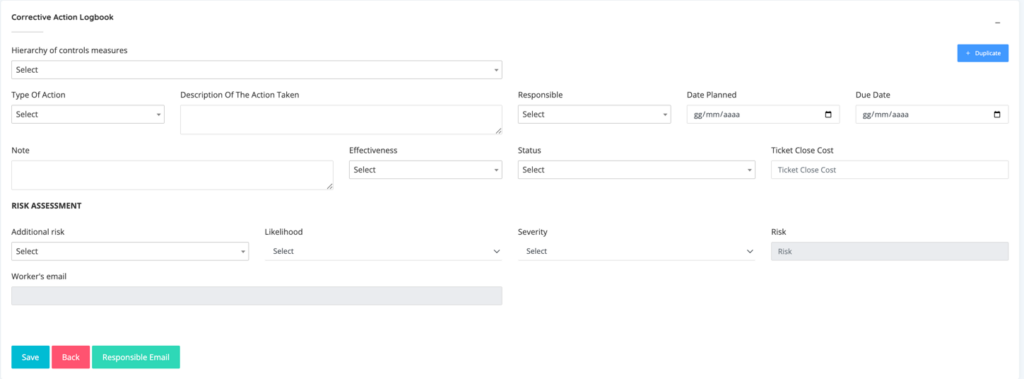
From KPIs to Action: Closing the Loop
- Collect safety data (near misses, observations, incidents)
- Visualize trends and hotspots
- Assign corrective actions with owners and due dates
- Verify effectiveness after implementation
- Improve standards, training, and controls
How Digital Tools Transform Safety KPI Management
Modern EHS tools automate KPI calculations, standardize reporting, and provide dashboards for operational decisions. The result: less time spent on reporting and more time spent on prevention.
Turn Safety KPIs into decisions, actions and verified improvement.
A dashboard should do more than display numbers. SpeakUp4Safety connects field data with analysis and action, helping EHS teams move from reporting what happened to understanding where to act next.
From data to prevention. SpeakUp4Safety connects reporting, Safety KPIs, corrective actions and effectiveness in one traceable management workflow.
Try the analyzer, validate the value, then connect the workflow. If the dashboard helps you see trends faster, the next step is a SpeakUp4Safety license: automate data capture, KPI calculation, corrective actions, responsibilities and follow-up in one environment. Review the plans or request a demo before choosing your subscription.
FAQ
What are the most important Safety KPIs to monitor?
A strong set combines lagging indicators (TRIR, LTIR) with leading indicators (near miss reporting and corrective actions closed on time). The right mix depends on your hazards and operational risk profile.
How do you calculate near miss rate and corrective action closure rate?
Near miss rate: (Near miss reports ÷ Total employees) × 100. Closure rate: (Actions closed on time ÷ Actions due) × 100. Use the same period (weekly or monthly) to compare trends.
How many Safety KPIs should a dashboard include?
Typically 8–15 well-chosen KPIs are enough. Focus on relevance, trend visibility, and actionability. Add more only if each KPI triggers a clear decision.
What is an EHS KPI dashboard?
An EHS KPI dashboard is a digital view of your safety, health and environmental indicators. It combines lagging indicators such as TRIR and LTIR with leading indicators such as near miss reports and corrective actions closed on time, so teams can spot trends and prioritize prevention.
What should I look for in safety dashboard software?
Look for mobile data capture, automatic KPI calculation, drill-down by site and department, CAPA integration with owners and due dates, effectiveness verification and an audit trail. Use the checklist above during a software demo.
Can I try SpeakUp4Safety before choosing a plan?
Yes. Start with the free Safety KPI Analyzer to test monthly KPI calculations, rolling trends and injury body analysis with your own data. If you want those indicators fed automatically by your operational reporting and connected to CAPA, request a dashboard demo and compare the available plans and licenses.
Conclusion
Safety KPIs and dashboards help EHS teams move from reactive reporting to preventive decision-making. Track leading indicators, near misses, and corrective action effectiveness to drive measurable improvement.
Ready to move from spreadsheets to a connected EHS KPI dashboard? See how SpeakUp4Safety brings reporting, KPIs and corrective actions together.
Questions and answers on this topic
Do you have practical questions or want to go deeper into the topic? In this section we collect the most relevant questions asked by EHS professionals together with the official answers from the SpeakUp4Safety Team, to help you turn concepts into concrete actions.
Do you have a question about this topic?
Submit your question by email. It will be reviewed by our specialists and, if relevant for the community, published with an official response.
Privacy note: the information you provide will be used exclusively to respond to your request.