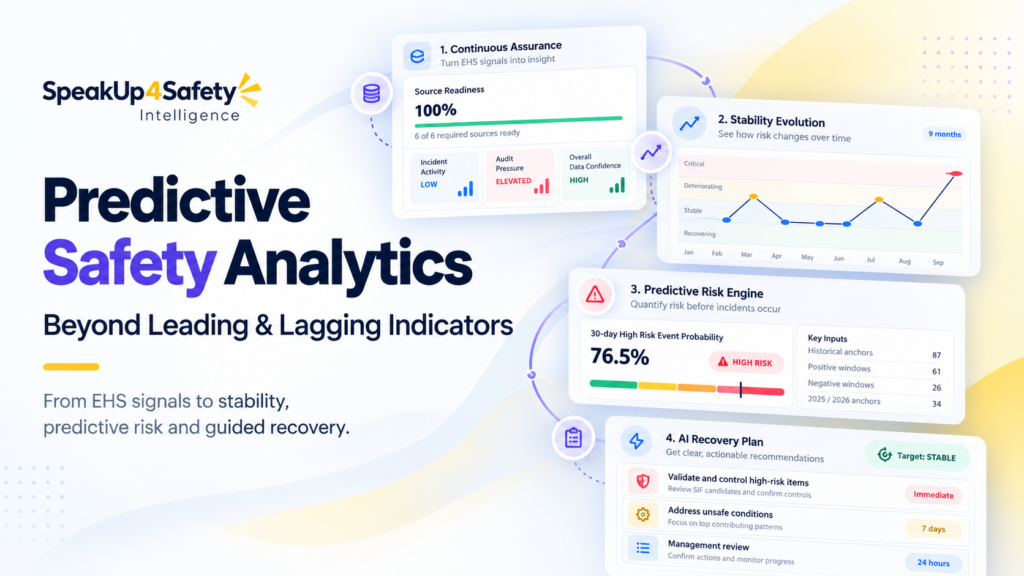
Leading and lagging indicators tell you what happened. Predictive indicators tell you what may happen next.
Traditional EHS dashboards are built to describe performance. SpeakUp4Safety Intelligence is designed to go one step further: interpret system stability, estimate future risk when enough historical data exists, and suggest the actions that can help move the organization back toward a stable, lower-risk condition.
Leading indicators and lagging indicators are essential — but they are not predictive indicators.
Most safety dashboards combine two families of measures. Lagging indicators describe outcomes that have already happened, such as injuries, first aid cases, lost-time events or incident rates. Leading indicators describe preventive activity or early warning signals, such as unsafe conditions, near misses, audit findings, training gaps, overdue actions or high-potential observations.
Both are valuable. The limitation is that they are usually displayed as separate numbers, trends or traffic lights. A manager can see that unsafe conditions increased, legal backlog is elevated and training gaps remain open — but the dashboard does not necessarily explain whether those signals together indicate a system that is stable, recovering or deteriorating.
| Indicator type | Primary question | Typical examples | Limitation when used alone |
|---|---|---|---|
| Lagging | What has already happened? | First Aid, Incident, injury rates, lost-time events | Excellent for outcome review, but inherently retrospective. |
| Leading | What preventive or precursor signals are present? | Unsafe Conditions, Near Misses, Audit Findings, Training Overdue, Legal Overdue | Shows precursors, but often as disconnected KPIs. |
| Predictive | What is the system trajectory and what may happen next? | Stability state, 30-day Injury Event probability, 30-day High Risk Event probability | Requires sufficient history, calibration and strict safeguards against over-interpretation. |
| Prescriptive / Recovery | What should we act on now? | Prioritized recovery actions linked to drivers, owners and measurable targets | Still requires competent human validation and operational judgement. |
The distinctive step is not adding another KPI. It is converting multiple EHS signals into a temporal interpretation of the system — and then linking that interpretation to preventive action.
From operational data to Continuous Assurance.
The engine begins with data that already exists inside the organization. Instead of treating every form as an isolated workflow, SpeakUp4Safety Intelligence converts selected data streams into normalized observations that can be compared over time.
Operational forms, events, findings, legal requirements and competence signals.
Build comparable 7, 30 and 90-day feature snapshots for each tenant.
Evaluate temporal stability, potential injury exposure and predictive risk.
Translate adverse drivers into prioritized actions and measurable recovery targets.
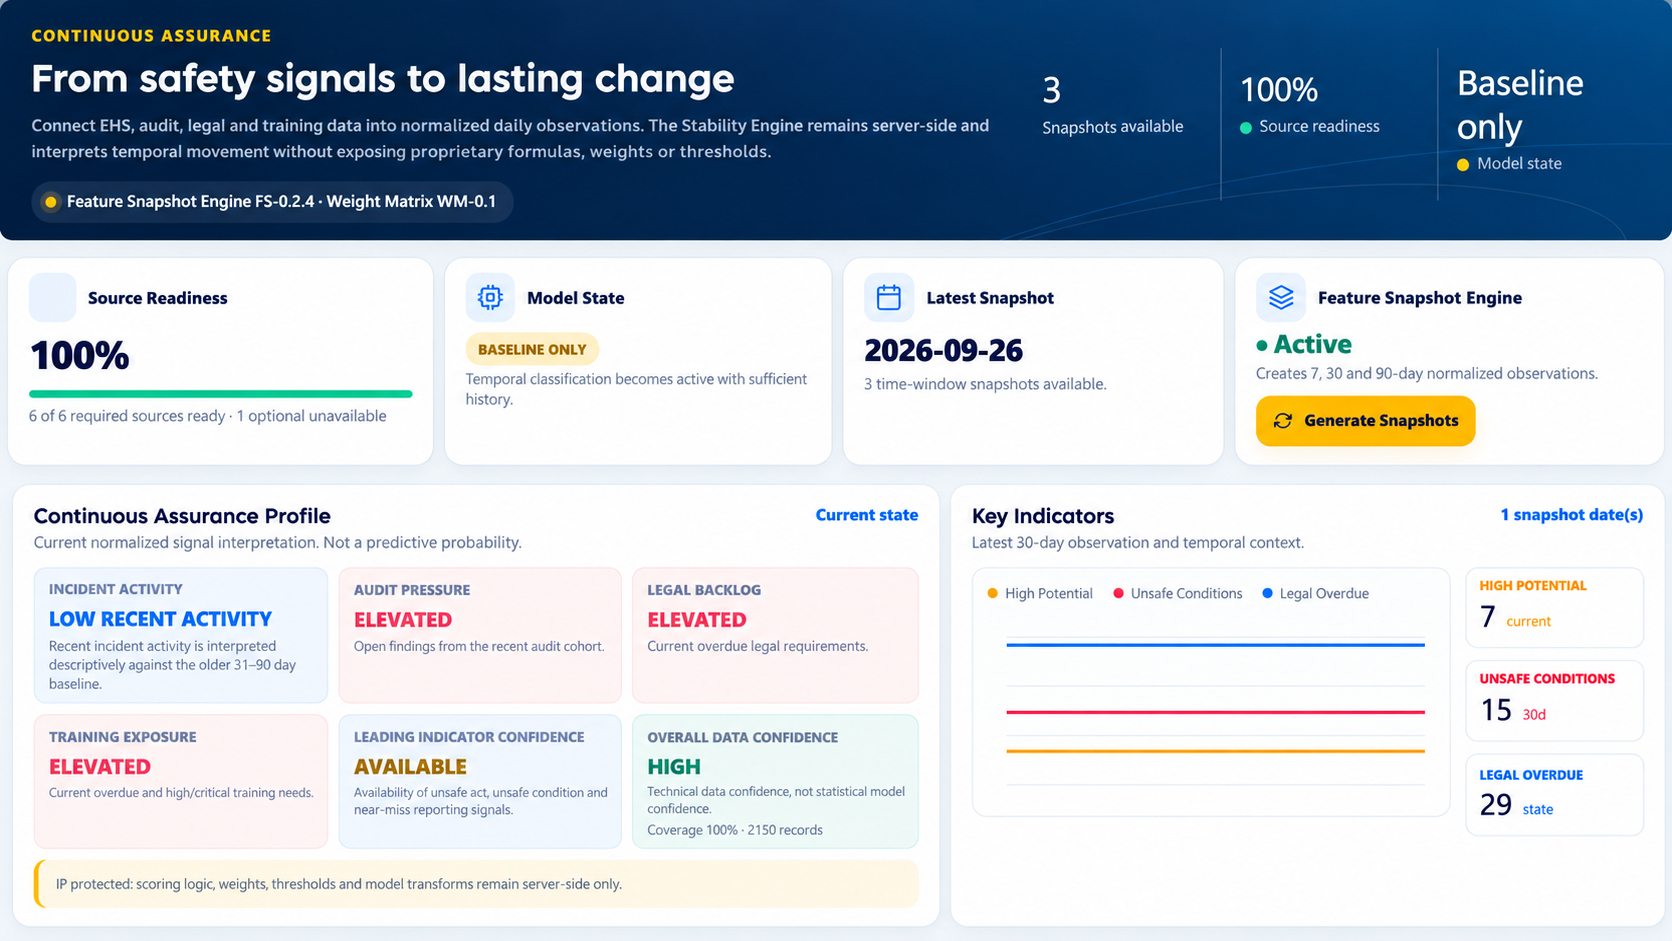
The baseline is temporal, not just a fixed target.
SpeakUp4Safety Intelligence creates daily snapshots over different observation windows. The recent 7-day and 30-day windows show the current operating condition, while the 90-day context provides a broader reference for understanding persistence and movement.
Where the source allows reliable historical reconstruction, the system compares recent activity with an older context — for example, a recent 30-day incident pattern can be interpreted against the preceding 31–90 day period. The objective is not to compare one KPI with an arbitrary industry number, but to understand whether the organization is moving away from or back toward its own stable operating condition.
For the monthly view, the platform reconstructs month-end states from dated source records. This creates a Stability Evolution trajectory that can show transitions such as Stable → Deteriorating → Critical before or around adverse events.
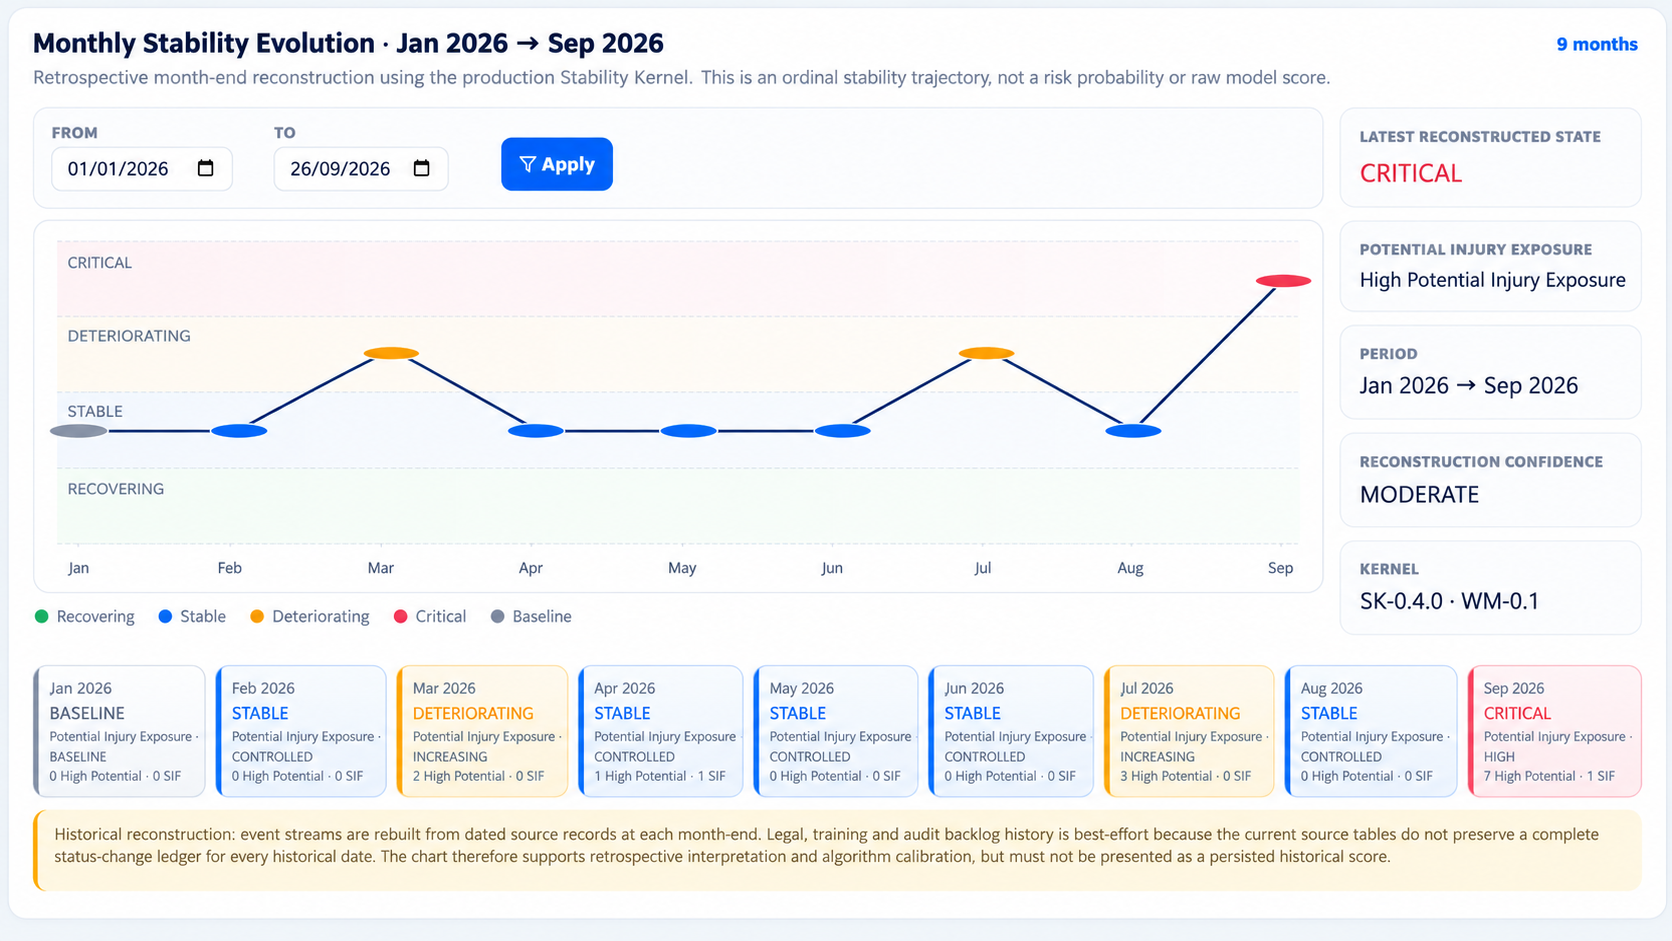
Four operational states translate multiple indicators into one trajectory.
The stability state is intentionally separated from injury probability. A system can be deteriorating even before an injury occurs. That is precisely where the preventive value lies: the organization should act on the trajectory before the lagging signal appears.
When enough history exists, the platform estimates 30-day future-event probability.
The Predictive Risk Engine uses historical anchor dates. At each anchor, it uses only information that would have been available up to that date, then checks what happened in the following 30 days. This produces labelled examples for model calibration without intentionally using future information in the predictors.
Two company-level targets are maintained:
- P1 — 30-day Injury Event Probability: probability of at least one First Aid or more severe incident in the next 30 days.
- P2 — 30-day High Risk Event Probability: probability of a future high-risk event such as a SIF candidate, high-potential/high-energy event, First Aid or incident.
The engine does not release a probability simply because a mathematical model can calculate one. It first checks whether the historical dataset contains enough observations, enough positive and negative windows, and an acceptable chronological holdout structure. If those gates are not met, the correct output is Probability Not Released.
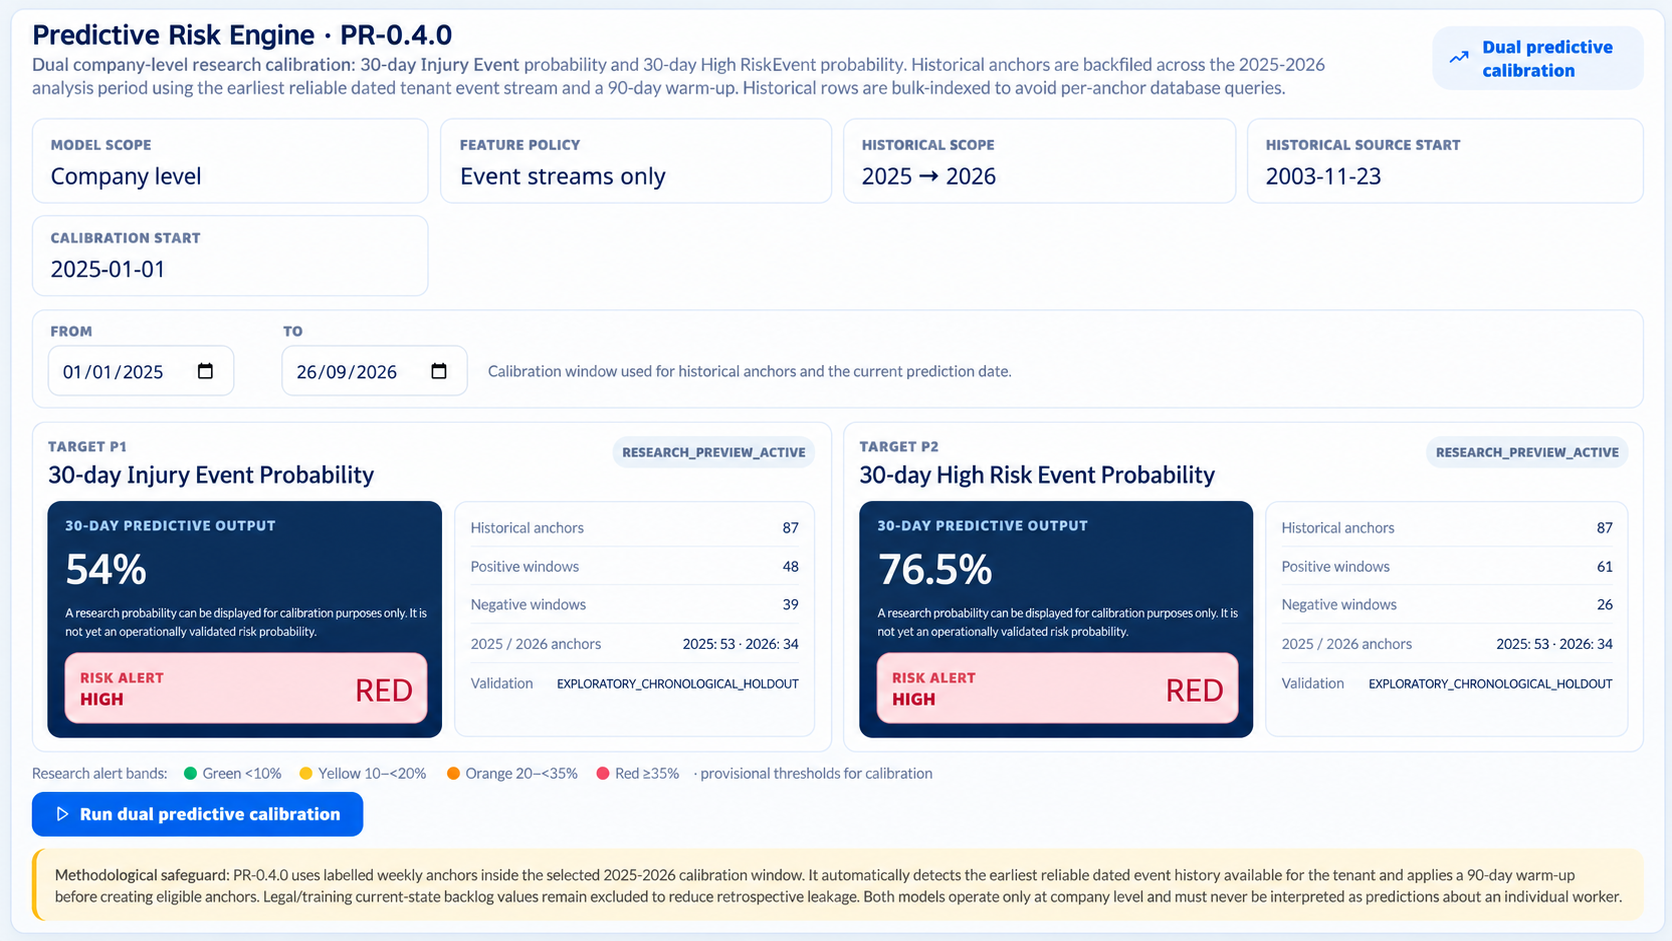
How to read the predictive alert bands
The current bands are operational calibration bands used to make the output easier to interpret. They are not universal safety thresholds and should not be treated as a scientifically universal accident probability scale.
The organization should act on the drivers, not wait for the lagging indicator.
The most important behaviour change introduced by predictive intelligence is timing. If the system is deteriorating, unsafe conditions are accumulating, high-energy exposure is present and the predictive alert is moving from green toward orange or red, waiting for an injury to validate the concern defeats the purpose of prevention.
Keep critical controls effective, sustain reporting quality and monitor whether leading indicators remain within the normal operating pattern.
Review rising leading indicators, recurring unsafe conditions, competence gaps and recent findings. Verify controls in the field before the trend becomes persistent.
Prioritize high-potential and high-energy conditions, risk-rank findings, accelerate overdue actions and assign named owners to measurable risk-reduction actions.
Run a focused cross-functional review, verify SIF/critical-energy controls, increase field verification and remove or reduce exposure where critical controls are not effective.
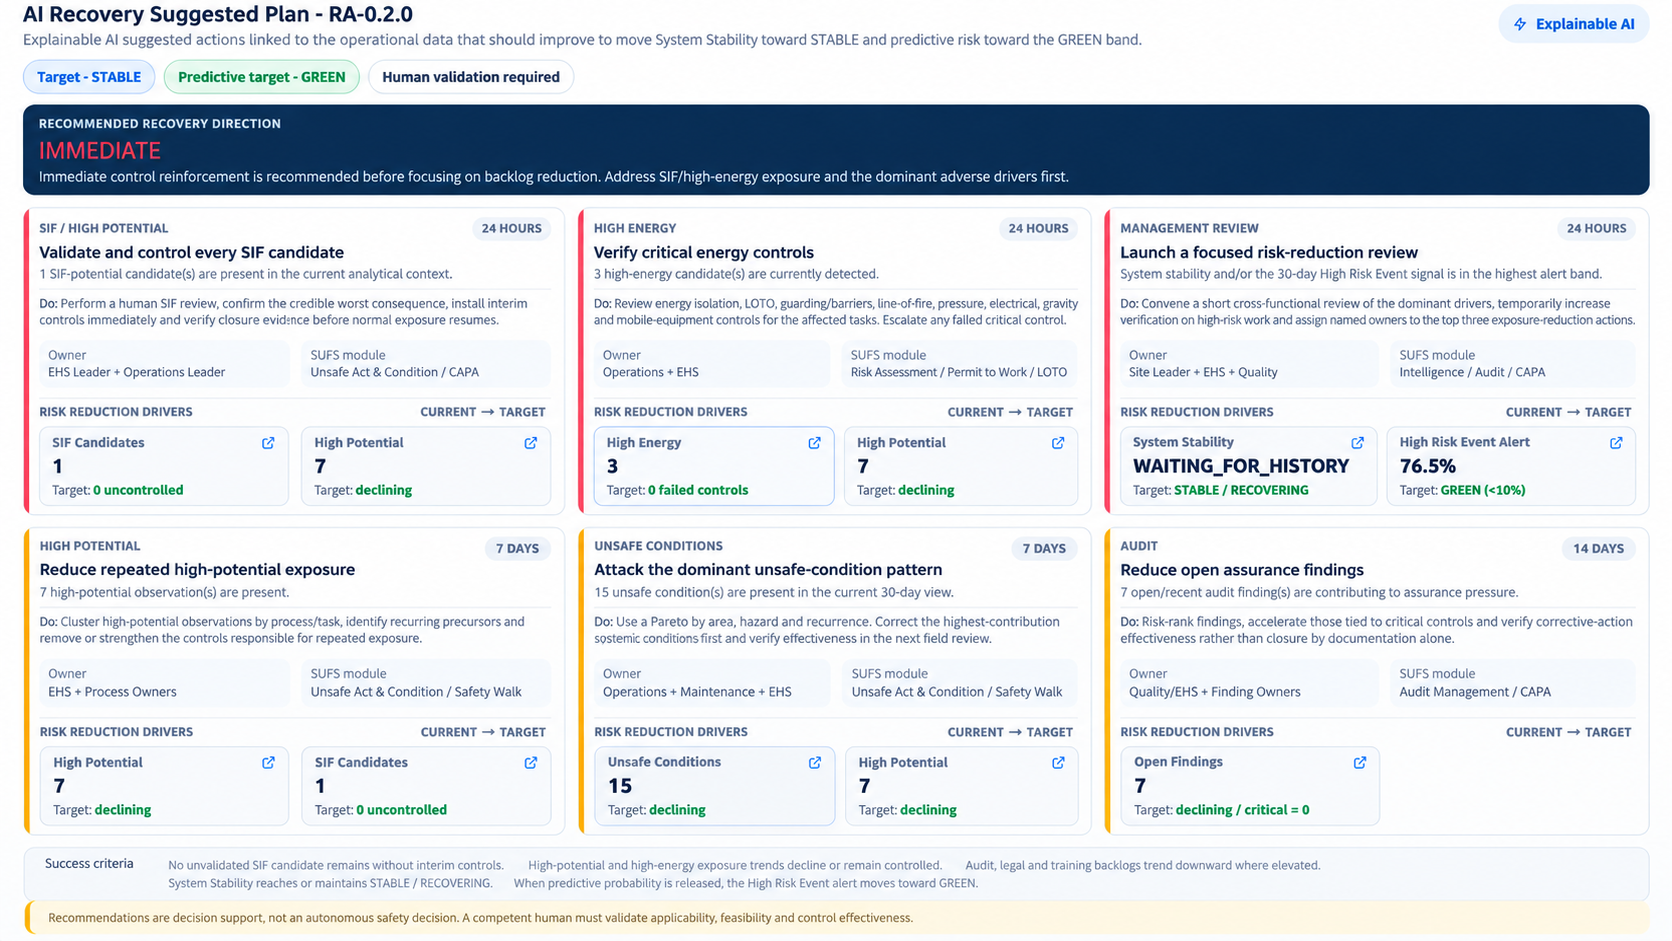
Prediction becomes useful only when it changes what the organization does next.
SpeakUp4Safety closes the loop with an explainable Recovery Suggested Plan. Each recommendation is linked to the data that contributed to the adverse state and to the operational target that should improve.
A card can therefore show:
- Why the action is suggested — for example SIF Candidate, High Energy, Unsafe Conditions, Audit Findings, Legal or Training backlog.
- What to do — a specific preventive or verification action.
- Who should own it — EHS, Operations, Quality, Site Leadership or another defined function.
- Where to manage it — direct link to the relevant SpeakUp4Safety module.
- Current → Target — the operational driver and the desired recovery direction.
- Success criteria — how the organization knows the action is reducing exposure.
The suggested plan is intentionally human-reviewed. It is decision support for competent professionals, not an autonomous safety decision system.
Detection → Stability → Prediction → Recovery.
That sequence is the main difference between SpeakUp4Safety Intelligence and a conventional EHS dashboard. Traditional dashboards are often excellent at reporting. Intelligence should help the organization understand movement, anticipate exposure and act before the adverse outcome becomes a lagging indicator.
Incidents, unsafe conditions, near misses, audit findings, legal requirements, training and custom forms.
Recovering, Stable, Deteriorating or Critical with Potential Injury Exposure.
Research-calibrated Injury Event and High Risk Event probability when statistical gates are satisfied.
Actions linked to drivers, owners, modules and measurable recovery targets.
Predictive EHS Intelligence: common questions.
What is the difference between a leading indicator and a predictive indicator?
A leading indicator describes a precursor or preventive activity, such as unsafe conditions, near misses, audits or training gaps. A predictive indicator uses historical relationships between multiple signals and future events to estimate a future risk state or probability, subject to sufficient data and validation.
Does SpeakUp4Safety predict which worker will be injured?
No. The predictive models operate at organization or tenant level. They are not designed to predict individual workers or make personnel-level safety decisions.
How is the baseline built?
The platform uses normalized 7, 30 and 90-day observation windows, temporal comparison and historical reconstruction from dated source records. The baseline is therefore a dynamic operating reference, not simply a fixed external benchmark.
What does CRITICAL mean?
CRITICAL means that adverse signals are converging strongly enough to require immediate management attention. It does not mean that an injury is certain to occur. It indicates high potential injury exposure within the Stability Engine interpretation.
When is a predictive probability shown?
Only when the calibration dataset passes minimum data-sufficiency and validation gates. When those criteria are not met, the system withholds the probability rather than displaying a fragile number.
How should the organization use the AI Recovery Suggested Plan?
As decision support. The recommendations should be reviewed by competent EHS and operational professionals, adapted to the real work context, assigned to accountable owners and verified for effectiveness.
Move beyond reporting. Understand the trajectory before the injury signal appears.
See how Continuous Assurance, the Stability Engine, Predictive Risk Engine and AI Recovery Suggested Plan can work together on your organization’s own EHS data.
Request an Intelligence demo ↗